
Course Description
In today's data-driven era, data visualization has become an important tool for analytical decision-making. Whether it is professional JS libraries (e.g. D3.js, ECharts), mainstream programming languages (Python, R), or even low-barrier BI tools (Power BI, Tableau), high-quality visualizations can be achieved. This course focuses onPython Data VisualizationintegrateMatplotlib.Seabornrespond in singingPyechartsThree mainstream libraries provide a complete learning path from basic to advanced.
Course Features
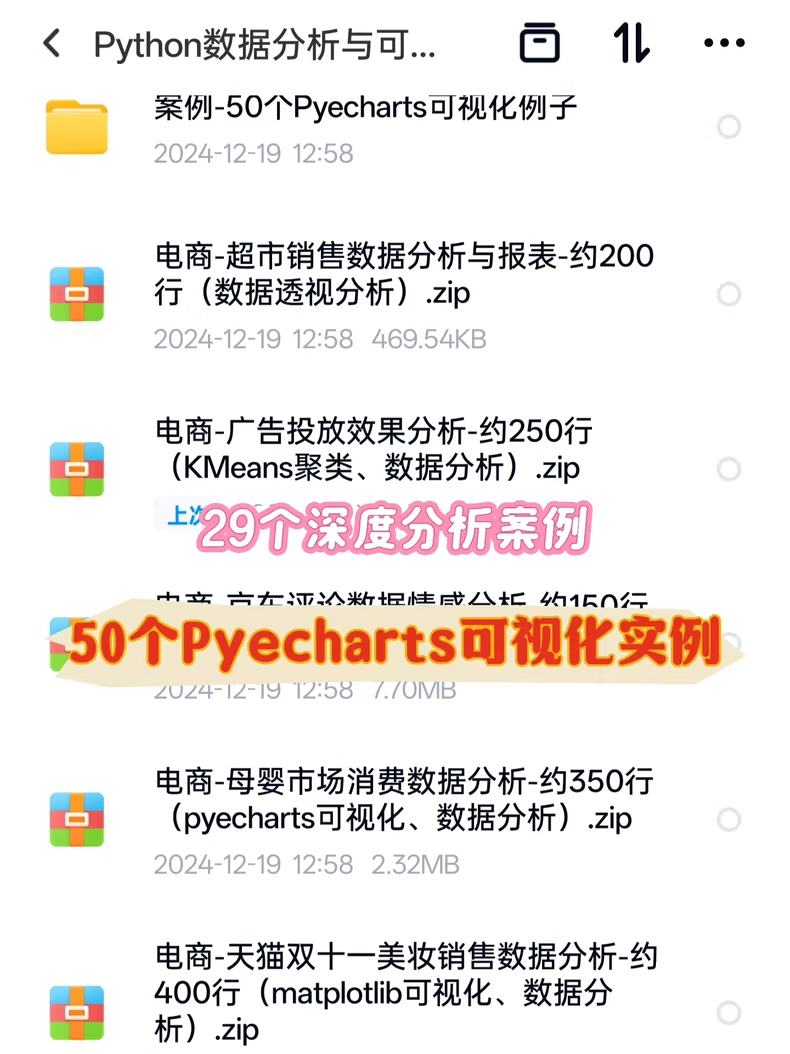
✅50 Featured Visualizations
- Cover practical scenarios such as workplace data analysis, user behavior research, social media sentiment analysis, etc.
- Each case provides approximately 300 lines of runnable code to ensure that learning is put to use.
✅29 in-depth data analysis projects
- Involved in a variety of areas such as movie box office, sporting events, demographics, etc.
- Complete datasets and analysis reports to enhance real-world capabilities
✅Interactive big screen visualization in practice
- Comparative Analysis of Domestic and Imported Movie Box Office
- Spring Festival Movie Market Trend Visualization
- Build dynamic and interactive charts based on Pyecharts
✅Combining Machine Learning and Visualization
- Algorithmic applications of Support Vector Machines (SVM), Random Forests, XGBoost, etc.
- Logistic regression and visual presentation of results for more intuitive data insights
Fits the crowd
✔ Developers looking to improve their Python data analysis skills
✔ Professionals engaged in business analysis, market research
✔ Team managers who need data visualization to support decision making
✔ Learners interested in big data and machine learning
learning experience
📌 Mastery of Matplotlib, Seaborn, Pyecharts core skills
📌 Work independently on enterprise-level data visualization projects
📌 Understanding best practices for combining machine learning models with visualizations
📌 Obtain complete code and datasets that are directly reusable
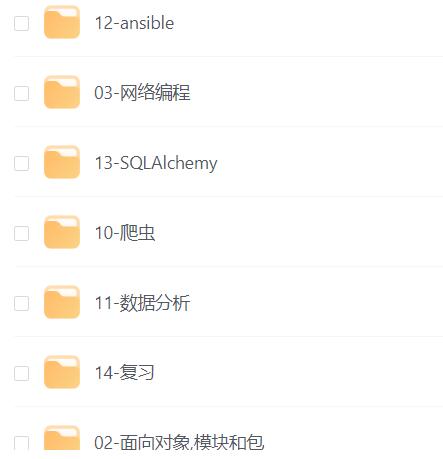
Curricular resources
🔹 Jupyter Notebook Format Source Code Out of the Box
🔹 HD Chart Analysis and Optimization Solution
🔹 Continuously updated industry casebook
All content in this course meets technical compliance requirements, focuses on legal and efficient data analysis skills improvement, and helps learners to quickly apply Python visualization techniques in real work.
 1")
 2")
 3")
 4")


Comments (0)